
The practical focus here is Seunghyeon: what it changes, what to verify, and where the limits are.
If you follow Korean power-equipment stocks, you have probably watched HD Hyundai Electric swing hard during earnings season and wondered what to look at before the price moves. This article shows you how to build a small, repeatable "check axis" — a fixed set of signals you read in order so news, not the candle, drives your first read. The practical answer: define your axis once (news persistence, foreign flows, U.S. peer demand), record each signal with a timestamp, and only then look at price.
This is an AI Market Note, so a quick boundary first. Public posting on X is paused for this note; this is the standalone blog version. Everything below is scoped to as of 2026-06-16 and is built from the three sources listed at the end. It is a method you can reproduce, not a buy or sell instruction, a price target, or a promise of returns.
The direct answer: read signals in a fixed order, then price
The mistake most retail traders make during earnings season is reading the price first and then hunting for a story that explains it. That gets the causality backwards and makes you chase. A check axis flips it: you decide what you will look at and in what order before the market opens, so the candle is the last input, not the first.
For HD Hyundai Electric specifically, the note proposes three axes, ordered by how much they lead price:
| Axis | What you read | Why it leads price |
|---|---|---|
| News persistence | Is the power-equipment order/earnings news continuing, or was it a one-day headline? | A durable narrative survives a single down day; a one-off fades |
| Foreign flows | Net foreign buy/sell on the name and the sector | Foreign desks often move before the broad tape reacts |
| U.S. peer demand | NVDA and the data-center power-demand reaction overnight | Power-equipment demand is increasingly tied to AI buildout |
The table is the plan, but the work is in the prose: after each market open you write down whether the news continued, whether foreign desks were net buyers, and whether the U.S. power-demand story held overnight — then, and only then, you read the chart. That ordering is the entire point.
Why this name, this season
HD Hyundai Electric is a power-equipment maker (transformers, switchgear, grid hardware). Two things make it a useful test case right now. First, the sector has been volatile: one of the cited reports describes power-equipment stocks falling about 30% before attempting a rebound, with the argument that order books "never stopped" even as the price did. That gap between order flow and price is exactly what a check axis is built to detect.
Second, the demand driver has shifted upstream. AI data centers need enormous, reliable power, which feeds grid and transformer demand. That is why an overnight NVDA reaction and the broader data-center power-demand narrative belong on the same checklist as a Korean industrial name. The link is a hypothesis you verify each day, not a fixed law — some sessions it holds, some it does not.

This checklist turns Seunghyeon into visible pass/fail points, but the evidence in the article remains the source of truth.
Worked example: reproduce the axis on one session
Here is the smallest reproducible version. Treat it as a recipe, not a backtest — the values below are placeholders to show the shape of the record, since this note carries no observed run data.
Scenario. You want a pre-open read on HD Hyundai Electric for a single earnings-season session.
Input. Three things, each from a checkable source: today's power-equipment headlines, yesterday's foreign net flow on the name, and the overnight NVDA / data-center-power reaction.
Config. Write the axis as a tiny structured note you fill in every day:
# market_note_axis.yaml
as_of: 2026-06-16
ticker: HD Hyundai Electric
axis:
  news_persistence:   # continued | one-off | unclear
  foreign_flow:       # net_buy | net_sell | flat
  us_peer_demand:     # NVDA/data-center power reaction: up | down | flat
read_price_after_axis: true   # never fill price before the three above
Command-style fill. You can keep it in plain text or grep your own log to see how often each state recurred:
# count how many sessions news "continued" this month
grep "news_persistence: continued" notes/2026-06-*.yaml | wc -l
Expected output. A dated record where the three axes are filled before any price field, so you can later see whether your read led or lagged the candle.
2026-06-16 news=continued foreign=net_buy us_peer=up -> then read price
Common failure. The single most common mistake is back-filling the axis after you have already seen the price — at that point the note just rationalizes the candle. The second is treating the NVDA link as guaranteed; some sessions the U.S. signal and the Korean name simply diverge.
How to verify. Open the cited source for each axis, confirm the date is within your as_of boundary, and mark whether the signal is a fact (a reported net-flow number) or an interpretation (your read that the news "feels durable"). Keep those two columns separate.
How to apply it without fooling yourself
The signal scores attached to this note are a prioritization aid, not a forecast. They tell you which axis to weight, not which way price goes.
| Signal | Score (0–1) | Read it as |
|---|---|---|
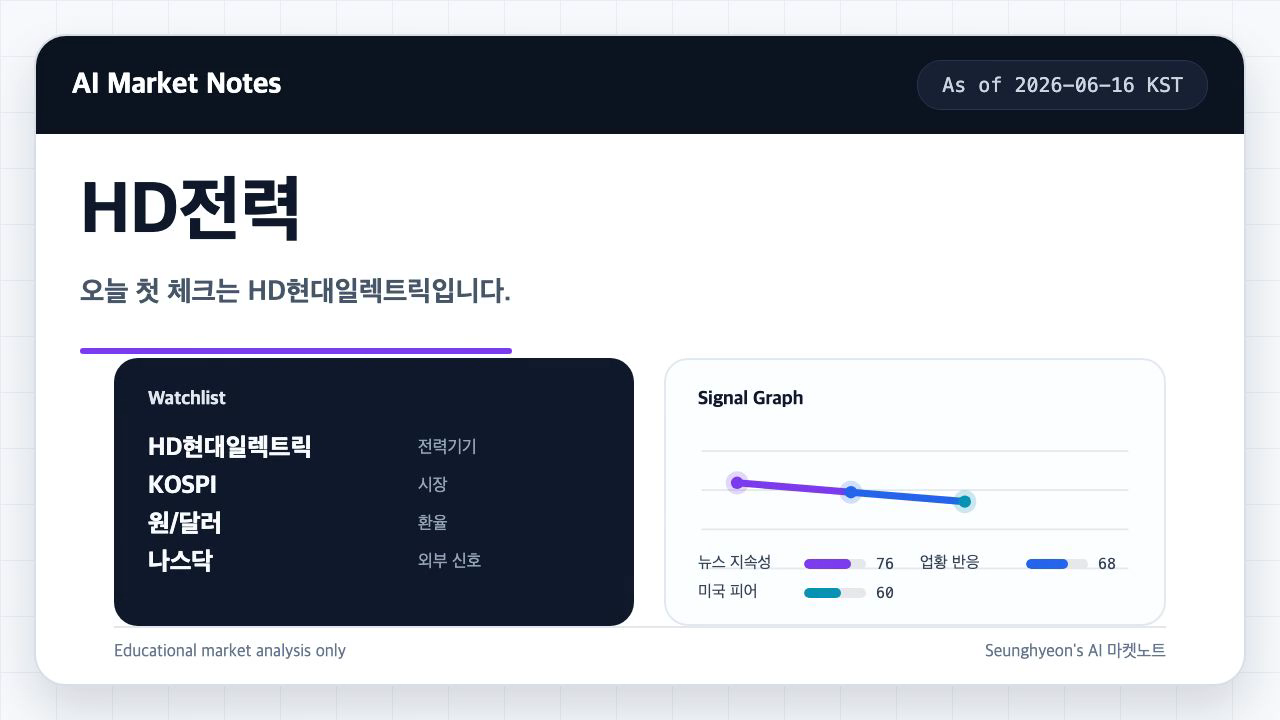
| News persistence | 0.76 | Strongest axis today — check headline continuity first |
| Sector/industry reaction | 0.68 | Secondary — confirm the move is sector-wide, not name-only |
| U.S. peer demand | 0.60 | Context — overnight NVDA/data-center power, treated as a hypothesis |
In practice this means: on 2026-06-16 you would start with the news-continuity question, confirm whether the whole power-equipment group is reacting or just this one name, and use the U.S. overnight tape as supporting context rather than a trigger. Higher score means "look here first," never "this will go up."
Three discipline rules keep the method honest. Check a verifiable source — the original report, an exchange flow page, market data — before you repeat any claim. Record the exact input, the date, and the environment so a reading is reproducible later. And separate proven facts from interpretation from your next-step guess, because earnings season blends all three if you let it.
Production caveats
This is the same caution any trading checklist needs. Data freshness matters most: a foreign-flow number from two days ago is a different signal than today's, so the as_of date is not optional. News persistence is easy to overfit — three headlines from one wire syndicating the same story is one event, not three. And the U.S.-peer link is the weakest leg by design; build the axis so that an NVDA divergence is informative rather than disqualifying. Nothing here sizes a position or sets a stop — that stays your decision, outside the scope of the note.
This article treats unmeasured numbers as unmeasured. If a source does not provide a benchmark, runtime, success rate, or cost figure, do not present one as a measured result.
FAQ
When should I use a check axis like this?
Use it during earnings season or any period when a name is news-driven and volatile, when you keep getting whipsawed by reading price first. It is most useful for a single name with a clear narrative, like a power-equipment maker tied to the AI-power story.
What should I check before applying it?
Confirm each axis has a real, dated source you can open, and decide your order of reading before the open. If you cannot point to where a signal came from, leave that field as "unclear" rather than guessing.
What is the easiest way to verify the result?
Keep the dated note and compare your pre-price read to what the candle actually did over several sessions. If your axis consistently led the move, it is working; if it only ever agreed with price after the fact, you are back-filling.
Sources and checks
Verified on: 2026-06-16
| Claim | Evidence | How to verify | Limit |
|---|---|---|---|
| Seunghyeon should be checked against the original source before reuse. | news1.kr | Check the source page, version, date, and setup notes. | Source content can change after this article is published. |
| Seunghyeon should be checked against the original source before reuse. | kbthink.com | Check the source page, version, date, and setup notes. | Source content can change after this article is published. |
| Seunghyeon should be checked against the original source before reuse. | asiae.co.kr | Check the source page, version, date, and setup notes. | Source content can change after this article is published. |
| Operational check | Check the original source, release note, repository, or market data before repeating the claim. | Reproduce on a small input and record input, output, and environment. | A local test does not prove every production path. |
| Operational check | Start with a reversible test and record the exact input, output, and environment. | Reproduce on a small input and record input, output, and environment. | A local test does not prove every production path. |
| Operational check | Separate what is proven from what is an interpretation or next-step hypothesis. | Reproduce on a small input and record input, output, and environment. | A local test does not prove every production path. |
🐦 Faster updates on X: @baegseungh7061
📚 More in this series: AI Market Notes
💌 Subscribe: Follow on X or grab the RSS
댓글
댓글 쓰기