
- A signal that looked strong in the earlier period reversed in the later period.
- Following U.S. House trade disclosures returned about −40bp per event after costs.
- Failing a test does not prove that a strategy has no effect.
On November 4, the research lab’s fourth day, I tested several rules that had been registered in advance. The results were 0/8 for the crypto hypotheses, 0/5 for following U.S. House members’ disclosed trades, and 0/9 for a Nasdaq100 strategy around the open. This is a personal research log, not investment advice.
1. A signal that looked good early reversed later
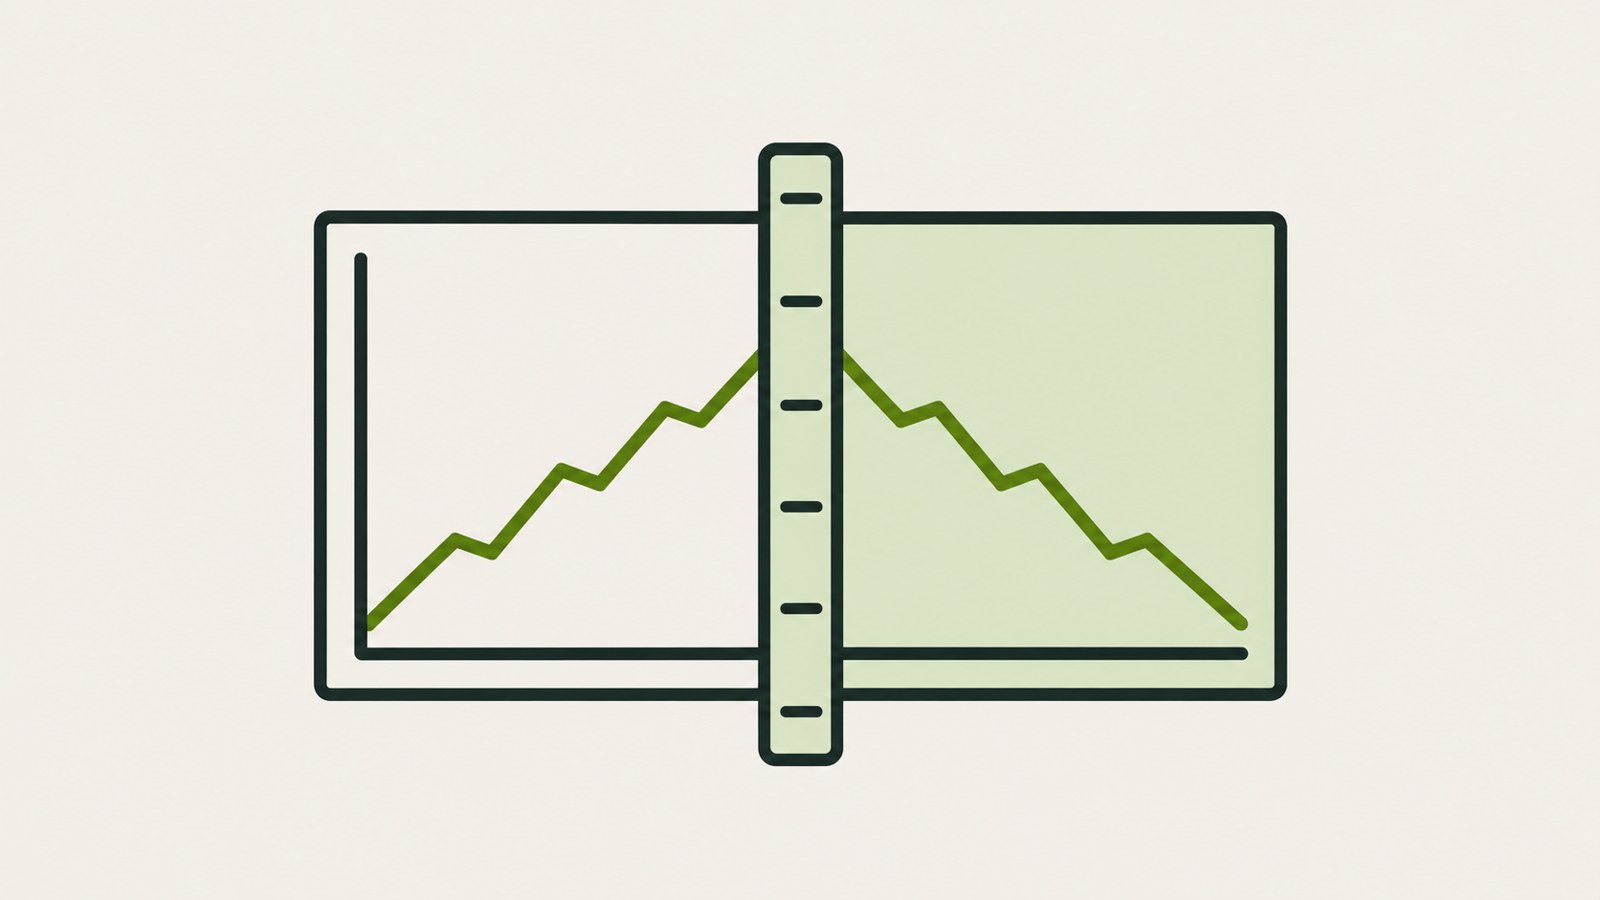
I tested four crypto hypotheses on BTC and ETH. One rule took the opposite side when futures funding rates reached extreme levels. For BTC, the earlier period (2020~2023) produced an average of +80.4bp, with t 3.09. Those numbers looked like they might pass.
In the later period (2024~2026), the average changed direction to −20.4bp. The results document showed that 60.6% of the earlier-period trades were buys. Simply buying every time at the same point would have returned +52.9bp. The signal had not been doing the work; it had been riding the rising market.
2. Following disclosed House trades
I also tested a rule that buys on the next trading day after a U.S. House member discloses a purchase, then holds for 20 trading days. The test covered 10,646 events.
Excess returns over the market were −7.7bp in the earlier period and +3.9bp in the later period. Neither result was distinguishable from zero. After subtracting 30bp in round-trip costs, the return was about −40bp per event. This result applies to following a disclosure after it appears. It does not answer whether the members’ trades themselves contain information.
| Experiment | Result | Main figure |
|---|---|---|
| Four crypto hypotheses | 0/8 | +80.4bp in the earlier period became −20.4bp in the later period |
| Following House disclosures | 0/5 | About −40bp per event after costs |
3. The strategy from the video was inconclusive

The Nasdaq100 opening-range breakout rule buys when price breaks above the first 15-minute range. I took it from a TikTok channel video about testing trading methods against data. The video reported 1,615 trades over 6 years and +97R. I did not verify those figures; I translated the rule shown in the video into a mechanical rule and tested that.
After the first calculation, I found two data errors and recalculated under a new version number. The result was +0.060R per trade in the earlier period (t 1.78) and +0.036R in the later period (t 0.84). The direction matched the video, but the results did not meet the criteria. The results document describes this as inconclusive, not as proof of no effect.
4. What a failed test means
In this research lab, a failed test means the rule fell short of criteria set in advance for this data, period, and cost assumption. It does not prove that the strategy has no effect.
The crypto results document also says the data cannot rule out a small effect of around 10~20bp. That is why I keep failed experiments with their numbers instead of deleting them.
That evening, the daily trend-following rule was the only one to clear all five criteria. It came after a string of rules that bought and sold on minute-level intervals had failed. Passing the test did not settle whether it was good news. The story continues in Part 3.
댓글
댓글 쓰기